
In the Fall of 2016 the Russell Library opened the DeKalb County School Desegregation Case Files for research. These files document litigation from 1968 to 1997 to desegregate the schools. In the course of this work, the lawyers collected data on students, staff, and the school system. All of the data includes race-based demographics, but much more information was gathered. For students, there might be test scores, frequency of disciplinary actions, home situation, or free/reduced school lunch enrollment. For teachers and administrators, there can be salaries, education levels, the number of years they worked in DeKalb, turnover and transfer information, gender, and information over who was not hired. For the school system, there is information on average daily attendance, building capacities and programs offered, seats available for the M-to-M (Majority-to-Minority) transfer program, and per pupil financial expenditures.
All of this data was critical for the lawyers to make their case about whether the DeKalb County Schools were fully integrated. But it could be of use to any study looking to analyze demographic information about DeKalb County children or educators from the 1970s thru the 1990s. For example, a researcher could analyze the relationship between race and scholastic performance, likelihood of being disciplined, or likelihood of being hired, just to name a few possibilities.
By way of an example, we took a single data table from the collection, "Racial Composition DCSS Schools, 1955-1986" and converted it into a spreadsheet in order to analyze the data. The whole process took less than an hour. The steps involved are:
1. Make a digital copy of the table. In our case we made a PDF using our photocopier. PDFs can also be made using an app on your phone. (image 1)
2. Convert the image to a spreadsheet. We opened the file in Adobe Acrobat and saved it as an Excel file. Since it was already in table form, Excel could recognize what information should be in each row and column. If the data is not clearly formatted as a table, it may take a little extra work to make it usable. (image 2)
3. Clean up the spreadsheet. The table was originally designed to be easy to read by humans, so there were repeating column headers at the top of each new page, blank rows to make it easier on these eyes, and the date is not associated with every row. These all had to be addressed before using Excel to do data analysis. I also formatted some columns as numbers so that we could do math on the data and checked a few of the rows against the original to be confident that the conversion had been accurate. (image 3)
4. Spreadsheets are very useful for asking questions of the data. To go one step further and get an overview of the data, I used Google Sheets to create a few graphs and to look for trends. By graphing the racial makeups of elementary and high schools over time (image 4), we can quickly see that there was always a higher proportion of black students in elementary school. Or by graphing the total number of students identified by race, we can see the number of white students steadily dropping beginning in 1971 (image 5) and trends in increasing diversity (image 6).
This example shows how much can be gleaned from one simple table. Researchers who combine data from multiple tables will be able to look even deeper at trends of race, school and employment success, economics, and more. There are data tables located throughout the collection, but boxes that are particularly rich include Series I. Alphabetical Files - Unitary Status - Areas of Inquiry (Boxes 7-10), Series III. Working Files - Data (Boxes 52-53 and 62), and Series III. Working Files - School Information Notebooks (Boxes 58-59). Exhibits, which are located throughout the collection, can also be good sources of data.
Post by Adriane Hanson, Digital Curator and Processing Archivist, Russell Library
All of this data was critical for the lawyers to make their case about whether the DeKalb County Schools were fully integrated. But it could be of use to any study looking to analyze demographic information about DeKalb County children or educators from the 1970s thru the 1990s. For example, a researcher could analyze the relationship between race and scholastic performance, likelihood of being disciplined, or likelihood of being hired, just to name a few possibilities.
By way of an example, we took a single data table from the collection, "Racial Composition DCSS Schools, 1955-1986" and converted it into a spreadsheet in order to analyze the data. The whole process took less than an hour. The steps involved are:
1. Make a digital copy of the table. In our case we made a PDF using our photocopier. PDFs can also be made using an app on your phone. (image 1)
 |
Image 1: Scan of table "Racial Composition DCSS Schools,
1955-1986" saved as a PDF. Source: Series III, Box 53, Folder 6. |
2. Convert the image to a spreadsheet. We opened the file in Adobe Acrobat and saved it as an Excel file. Since it was already in table form, Excel could recognize what information should be in each row and column. If the data is not clearly formatted as a table, it may take a little extra work to make it usable. (image 2)
 |
| Image 2: Table, "Racial Composition DCSS Schools," saved as an Excel spreadsheet using Adobe Acrobat Pro. |
3. Clean up the spreadsheet. The table was originally designed to be easy to read by humans, so there were repeating column headers at the top of each new page, blank rows to make it easier on these eyes, and the date is not associated with every row. These all had to be addressed before using Excel to do data analysis. I also formatted some columns as numbers so that we could do math on the data and checked a few of the rows against the original to be confident that the conversion had been accurate. (image 3)
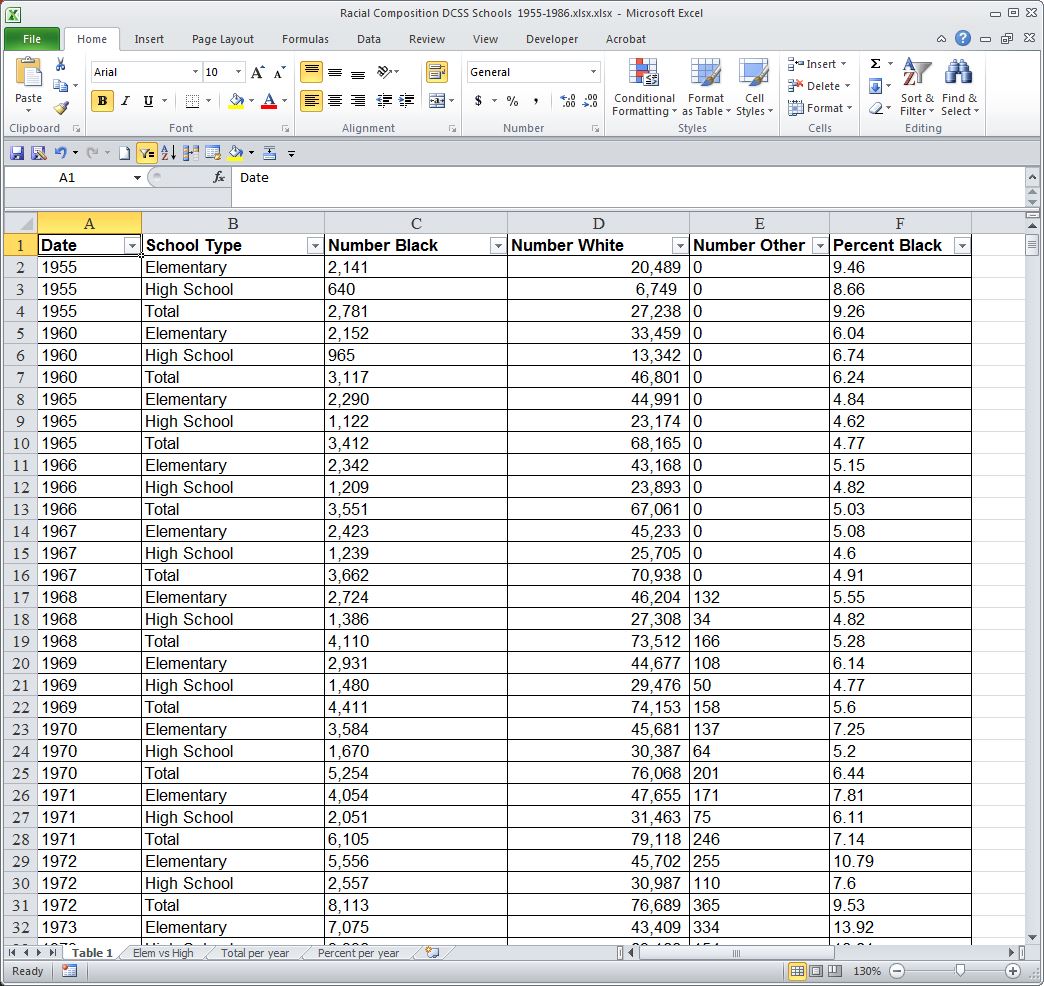 |
| Image 3: Table "Racial Composition DCSS Schools" after spreadsheet has been cleaned up using Excel. |
4. Spreadsheets are very useful for asking questions of the data. To go one step further and get an overview of the data, I used Google Sheets to create a few graphs and to look for trends. By graphing the racial makeups of elementary and high schools over time (image 4), we can quickly see that there was always a higher proportion of black students in elementary school. Or by graphing the total number of students identified by race, we can see the number of white students steadily dropping beginning in 1971 (image 5) and trends in increasing diversity (image 6).
 |
| Image 4: Graph of the percentage of the elementary school students and high school students who were black, 1955-1986. |
 |
| Image 5: Graph of the total number of students who were black, white,and other, 1955-1986. |
Post by Adriane Hanson, Digital Curator and Processing Archivist, Russell Library


No comments:
Post a Comment